

By Donald Begosh, S.A.M. Executive Director
From time to time, we get requests from our members for financial information on S.A.M.: where our money comes from, how much of it there is, and in what ways it is spent. Since I regularly make presentations to the international board on the state of S.A.M.’s finances, it might be helpful to also present this information here in the pages of News International so that you might have a better understanding of our financial operation.
Since its beginning nearly 65 years ago, S.A.M. has been supported solely by membership dues and proceeds from the sale of educational products. When we became one of the American Management Associations about four years ago, we adopted their method of accounting. To gain insight into this method of accounting and distribution of charges, it should be recognized that there are two types of operating units or departments in AMA.
The first are accountability centers. S.A.M ., the Presidents Association (PA), AM ACOM, and the Professional Institute (Pl) are all accountability centers in AMA. All income and “direct” expenses are charged to these centers. The second type of department in AMA is the support service or overhead department. The costs to maintain these departments are not charged directly to the accountability center. They are paid for by each accountability center’s net contribution to overhead. (Overhead costs not included in S.A.M.’s direct charges are membership, subscription, promotion and marketing services, rent, telephone costs, and so forth.)
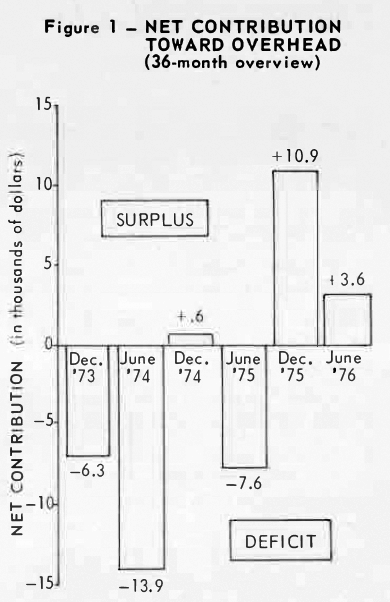
As Figure 1 shows, S.A.M. has made a significant turnaround in its net contribution to overhead in recent months, turning a $6,300 deficit ( in the period ending December 1973) into a $3,600 contribution ( projected for the period ending June 1976).
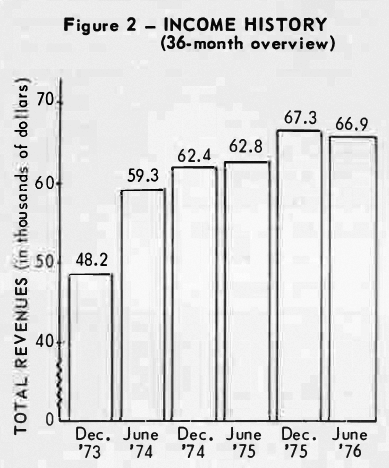
This turnaround in contribution to overhead is due partly to increases in total revenues. Figure 2 illustrates the increase in revenues over a 36-month period of $48,200 (per six-month period) to $66,900. But the greater part of the turnaround is the result of a rigorous expense control program.
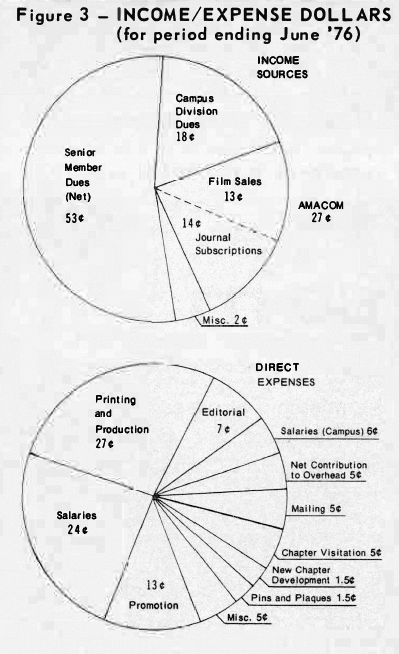
As for specific income sources (see Figure 3), the major source of our income is senior member dues (534 of every $ 1.00). The other major sources are the sale of our Advanced Management Journal and the time-study films through AMACOM-the communications arm of AMA-and campus division dues (27¢ and 18¢, respectively, of each $1.00). Direct expenses include a variety of costs, with the largest (27¢ of each $1.00) going for the printing and production of S.A.M.’s many periodicals and printed materials.
In conclusion, it should be remembered that S.A.M. is an all-volunteer membership organization structured around local chapters. The dedicated effort to manage these local chapters can never be measured financially. Only a balanced fiscal budget at the headquarters level can maintain and improve services to our members. SAM-NI
This SAM News International article is from our historical archive, information provided is for reference and archival research about the activities and developments of the Society.